Native Code improvements and tracing features - VB Decompiler v9.7
After several months of painstaking work, we are happy to introduce a new, much improved version of VB Decompiler. This time we also changed its key feature, native code decompilation. Many VB Decompiler users have been waiting for that, and finally, after a great deal of code refactoring, we succeeded in redesigning and considerably improving the emulator. Though the perfect version is to come yet, the native code emulator is already much better than it ever was. Here's some theory. Visual Basic lets the programmer select the native code compiler settings, namely to optimize for smaller code, to optimize for faster code, or not to optimize at all. In these three cases, the EXE file will contain quite different blocks of generated code. Starting from version 9.7, VB Decompiler equally well emulates all three types of optimization when creating partially decompiled code. Yeah, it really works! And here's more about what we've achieved, in addition to redesigning the emulator and improving its algorithms.
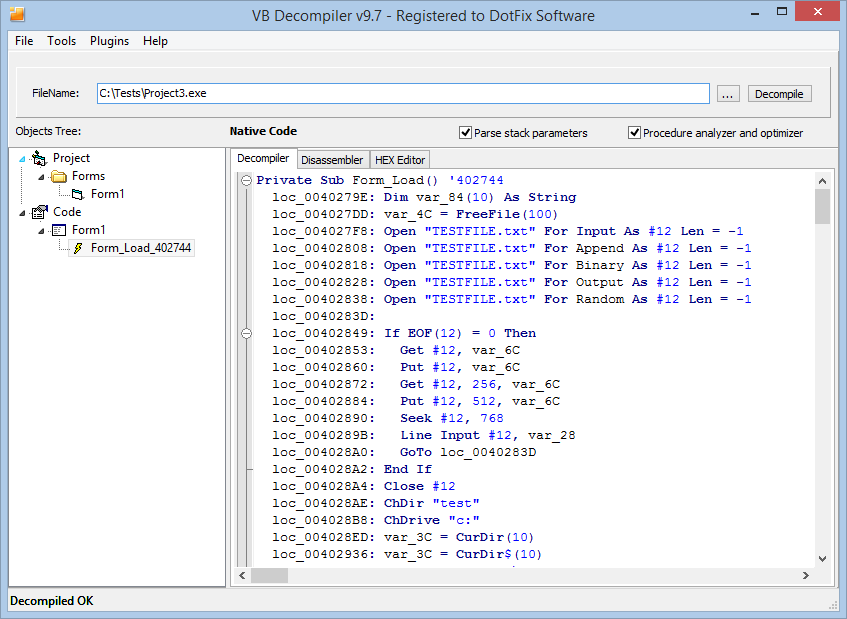
The improvements in the emulator would not be so obvious if VB Decompiler supported only some of MSVBVM60.DLL's API functions, and produced unidentified calls without any parameters for the other functions. So the new version of the decompiler contains a lot of new signatures for correct decompilation of nearly every API function in the MSVBVM60.DLL runtime library (for a list of changes, please see whatsnew.txt).
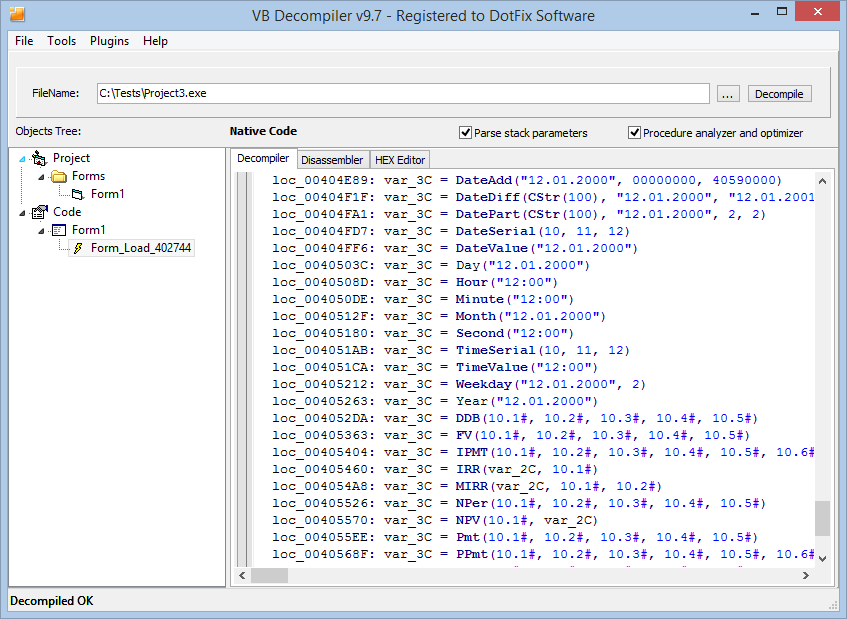
This feature was also long awaited by VB Decompiler users. And it took us a lot of efforts to implement it, too. Now, if the decompiler finds a call by CLSID (Class ID) and IID (Interface ID) to some external class, it will try to find the path to the DLL that contains that class. Then that DLL will be checked for the presence of TypeLib data, and for a corresponding IID. After that, the method or property will be found by the offset in the VTable (table of virtual methods and properties) or by DispID (Dispatch ID), the parameters will be analyzed, and a signature will be created so that VB Decompiler can recognize that call in the code. All you need to achieve that, is to have the called ActiveX components (DLL, OCX) registered in the system. So if you try to use the decompiler to analyze a file whose components have not been duly installed, such calls will be undetectable as the decompiler will not be able to find the path to the library by the specified CLSID.
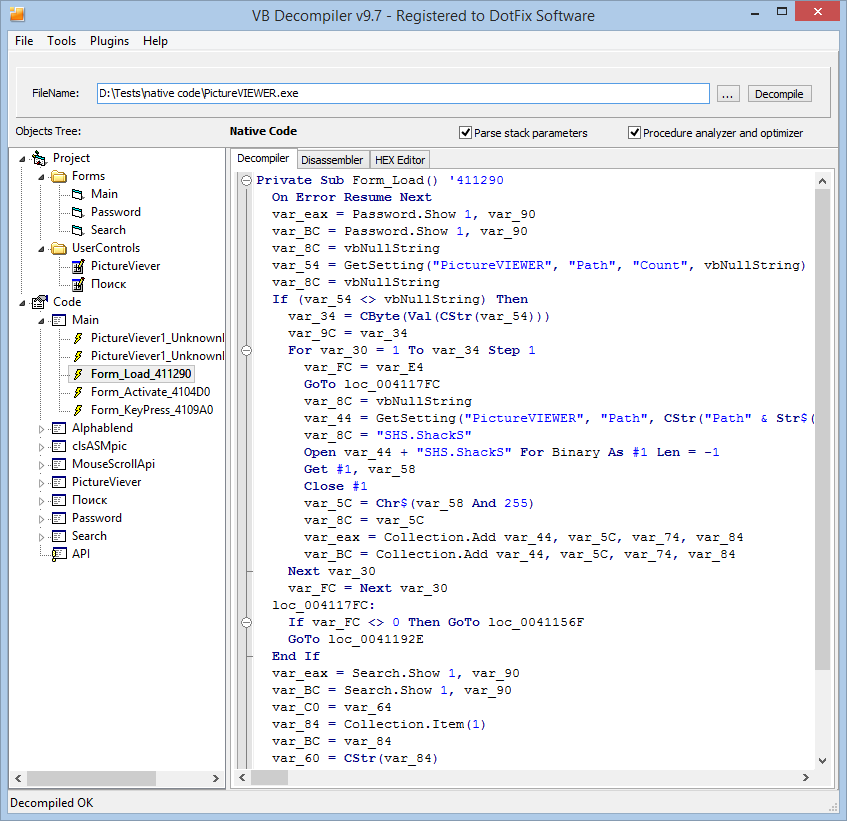
Starting from the early versions, VB Decompiler can save the results to a packed database (VDD file), and also open such databases. But until recently, you had to use the File menu for that purpose, which was somewhat awkward. Now you can open a VDD database just like any EXE/DLL/OCX file, from the command line or by drag-and-dropping a file to the decompiler window. Try that, it's very easy!
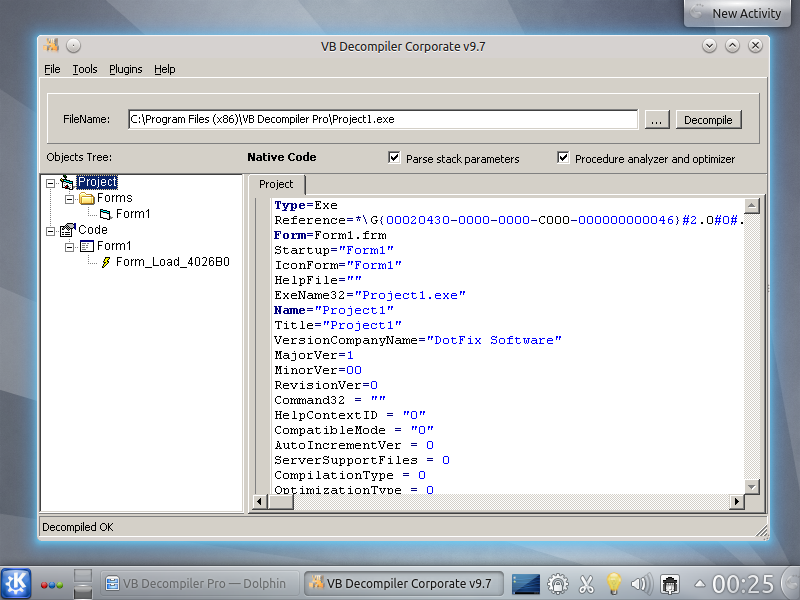
The safest way to reverse Windows applications is using Linux. We know about it and VB Decompiler now supports Wine. You can install and start VB Decompiler on most Linux based OS (Ubuntu, Debian, etc.).
Suppose you work in an anti-virus lab and use VB Decompiler to analyze files. When you study assembler code on the Disassembler tab, you probably would like to see what happens to that code after decompiling, not to keep comparing the assembler code with the code in the Decompiler window. Now that's possible! Just right-click the window with the decompiled code and select "Copy to disassembler."
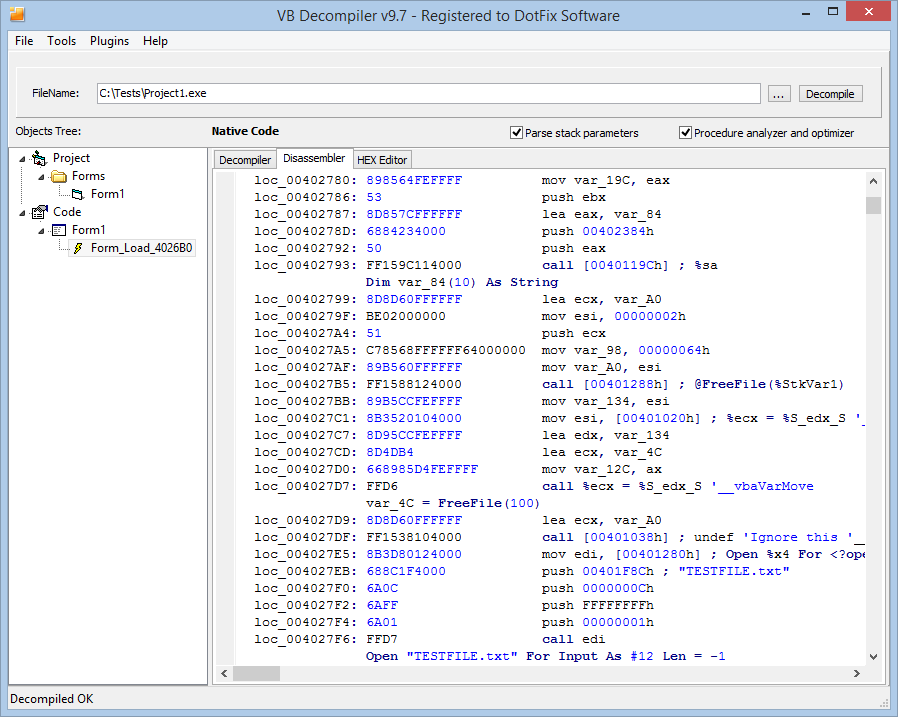
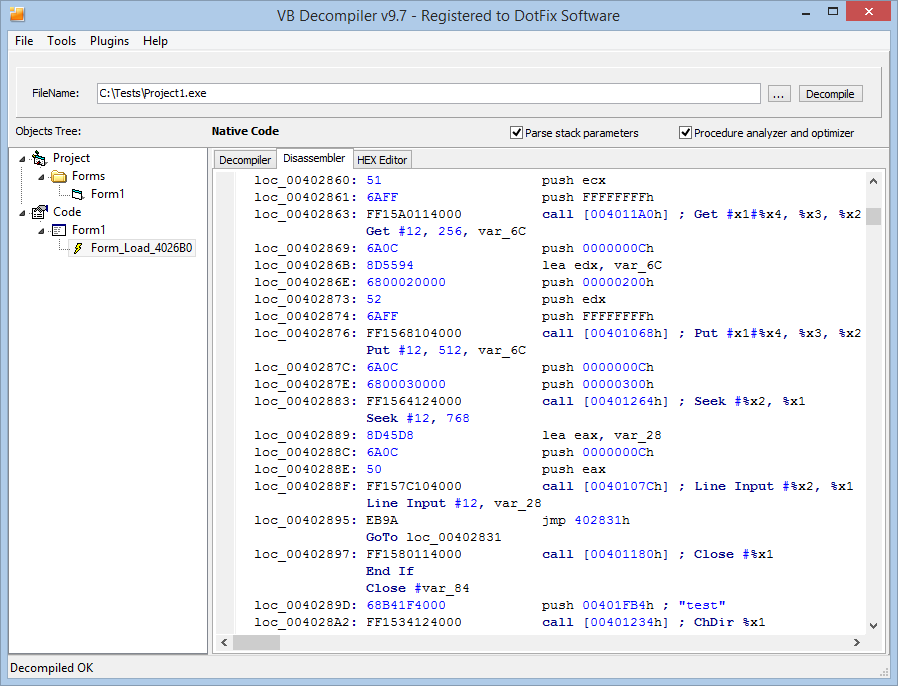
Finally, here's the coolest improvement. Thanks to redesigning the emulator, it has become possible to implement a much more advanced feature for analyzing native code. Now you can partially debug a program written in native code on the built-in emulator, without running the program on the real CPU!
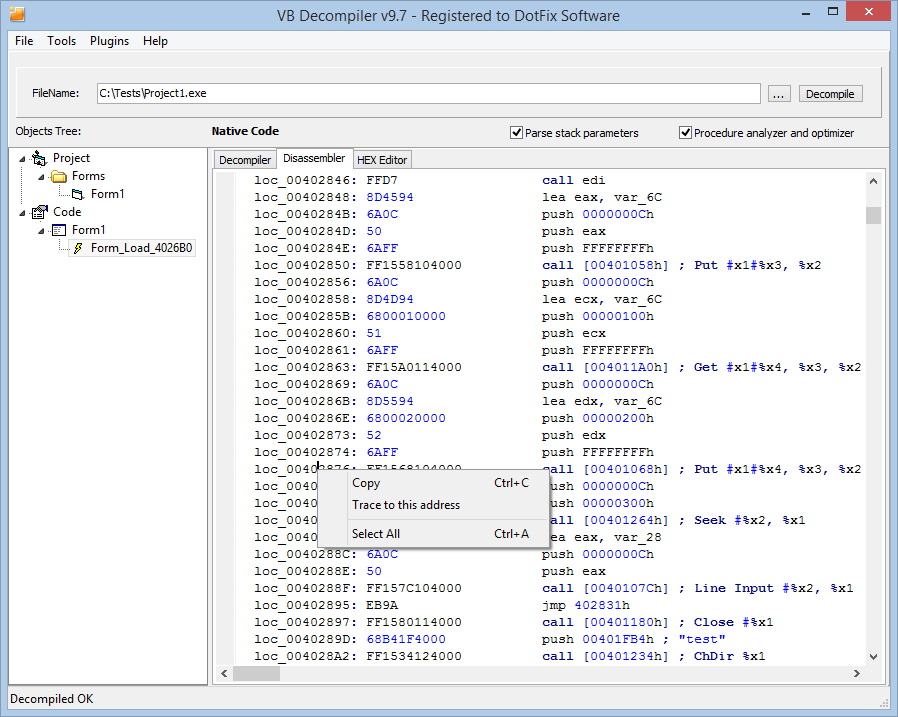
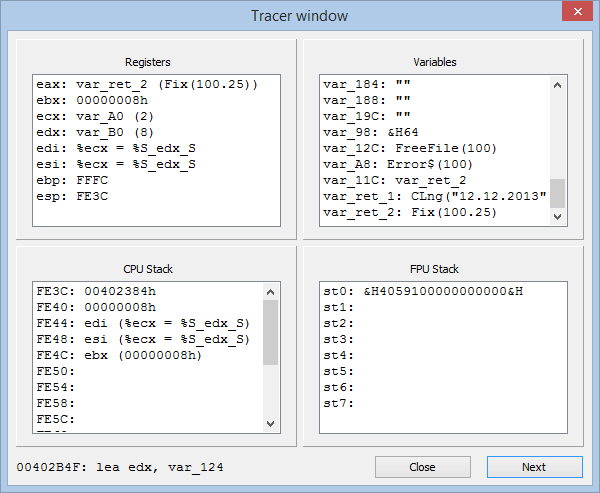
Tracing (or, to be more exact, step-by-step emulation) lets you put the emulation on hold on each line of the assembler code, so that you can check the processor and co-processor registers, the stack, and the variables. Because code is processed by the emulator, not run on the real processor, this feature will be very useful for virus analysts who examine malware in anti-virus labs.
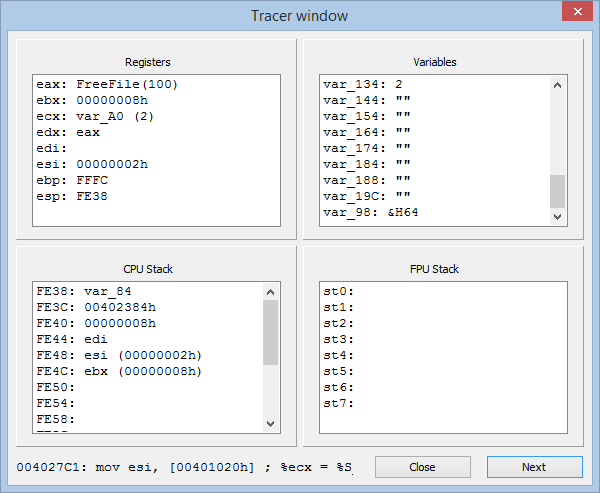
Now, a little bit of implementation details. Tracing is possible for an individual function only; when that function is being processed, the emulator will consider the stack, the registers, and the variables to be empty. So far, though the emulator already supports a lot of Intel x86 commands, some commands are not supported (and will be skipped when tracing code). The tracer also does not display any changes in flags. In the current implementation, only the processing of the cmp and jcc commands is affected by the flags. Calling external functions is not supported; yet both the stdcall and cdecl calls are correctly processed, with correcting the stack by sub esp, XX and add esp, XX. The current version of VB Decompiler only supports forward tracing, without looping inside loops, and without jumping over commands. As for the rest, the tracing is easy (you can continue or cancel it from the keyboard, without using the mouse) and almost like normal tracing.
Alas, this feature is not included in the basic licenses for VB decompiler. We've spent a great deal of time implementing the new tracing feature, but the number of potential users is very low. So we decided that using that feature would require buying a separate license.

Support for almost all API functions used in MSVBVM50.DLL and MSVBVM60.DLL
The improvements in the emulator would not be so obvious if VB Decompiler supported only some of MSVBVM60.DLL's API functions, and produced unidentified calls without any parameters for the other functions. So the new version of the decompiler contains a lot of new signatures for correct decompilation of nearly every API function in the MSVBVM60.DLL runtime library (for a list of changes, please see whatsnew.txt).

Automatic analyzing of external ActiveX methods and properties
This feature was also long awaited by VB Decompiler users. And it took us a lot of efforts to implement it, too. Now, if the decompiler finds a call by CLSID (Class ID) and IID (Interface ID) to some external class, it will try to find the path to the DLL that contains that class. Then that DLL will be checked for the presence of TypeLib data, and for a corresponding IID. After that, the method or property will be found by the offset in the VTable (table of virtual methods and properties) or by DispID (Dispatch ID), the parameters will be analyzed, and a signature will be created so that VB Decompiler can recognize that call in the code. All you need to achieve that, is to have the called ActiveX components (DLL, OCX) registered in the system. So if you try to use the decompiler to analyze a file whose components have not been duly installed, such calls will be undetectable as the decompiler will not be able to find the path to the library by the specified CLSID.

Handling VDD databases
Starting from the early versions, VB Decompiler can save the results to a packed database (VDD file), and also open such databases. But until recently, you had to use the File menu for that purpose, which was somewhat awkward. Now you can open a VDD database just like any EXE/DLL/OCX file, from the command line or by drag-and-dropping a file to the decompiler window. Try that, it's very easy!
Wine support
The safest way to reverse Windows applications is using Linux. We know about it and VB Decompiler now supports Wine. You can install and start VB Decompiler on most Linux based OS (Ubuntu, Debian, etc.).

Copying decompiled code to the disassembler window
Suppose you work in an anti-virus lab and use VB Decompiler to analyze files. When you study assembler code on the Disassembler tab, you probably would like to see what happens to that code after decompiling, not to keep comparing the assembler code with the code in the Decompiler window. Now that's possible! Just right-click the window with the decompiled code and select "Copy to disassembler."


Tracing the code
Finally, here's the coolest improvement. Thanks to redesigning the emulator, it has become possible to implement a much more advanced feature for analyzing native code. Now you can partially debug a program written in native code on the built-in emulator, without running the program on the real CPU!

Tracing (or, to be more exact, step-by-step emulation) lets you put the emulation on hold on each line of the assembler code, so that you can check the processor and co-processor registers, the stack, and the variables. Because code is processed by the emulator, not run on the real processor, this feature will be very useful for virus analysts who examine malware in anti-virus labs.

Now, a little bit of implementation details. Tracing is possible for an individual function only; when that function is being processed, the emulator will consider the stack, the registers, and the variables to be empty. So far, though the emulator already supports a lot of Intel x86 commands, some commands are not supported (and will be skipped when tracing code). The tracer also does not display any changes in flags. In the current implementation, only the processing of the cmp and jcc commands is affected by the flags. Calling external functions is not supported; yet both the stdcall and cdecl calls are correctly processed, with correcting the stack by sub esp, XX and add esp, XX. The current version of VB Decompiler only supports forward tracing, without looping inside loops, and without jumping over commands. As for the rest, the tracing is easy (you can continue or cancel it from the keyboard, without using the mouse) and almost like normal tracing.

Alas, this feature is not included in the basic licenses for VB decompiler. We've spent a great deal of time implementing the new tracing feature, but the number of potential users is very low. So we decided that using that feature would require buying a separate license.
March 14, 2014
(C) Sergey Chubchenko, VB Decompiler's main developer